Road Safety in Canada from 2016 to 2022
Paul Boase, M.A. and Brian Jonah, Ph.D.
Abstract
The purpose of this article is to evaluate the progress made on the level of road safety in Canada from 2016 to 2022, the first seven years of Canada’s Road Safety Strategy 2025. Data from the National Collision Database on fatalities and serious injuries were examined for this period and compared with the baseline period 2011 to 2015. The percentages of these fatalities and serious injuries that involved non-use of seat belts, speeding, driver distraction, alcohol, other drugs, intersections, young drivers aged 16 to 24, pedestrians, motorcyclists, bicyclists, commercial vehicles, and fatigue were also determined. There was not much change in fatalities from 2016 to 2022 but there was a downward trend in serious injuries from 2016 to 2019 followed by a slight upward trend from 2020 to 2022. The percentages for unbelted fatalities and serious injuries were generally at or below the baseline. The percentages of speed-related fatalities trended downward during 2016 to 2018, upward from 2019 to 2021, and then downward in 2022 while the percentages for serious injuries remained at or slightly above the baseline over the seven years. The percentages for fatalities at intersections were either at or below the baseline while the percentages for serious injuries were either at or above the baseline. The percentages for fatalities and serious injuries among young drivers aged 16 to 21 were below the baseline during the period from 2016 to 2022. The percentages for fatalities and serious injuries involving pedestrians were mostly at or above baseline. The percentages of fatalities and serious injuries involving motorcyclists were at or above the baseline level. The percentages for fatalities that were bicyclists were below the baseline, except for 2020 when it was at the baseline. The percentages for serious injuries that were bicyclists were at or above the baseline, except for 2018 and 2019 when they were below the baseline. The percentages of both fatalities and serious injuries that involved commercial vehicles were at or below the baseline from 2016 to 2022. The percentages for fatalities where driver distraction was involved were at or below the baseline while the percentages for serious injuries mostly remained at or below the baseline level during 2016 to 2022. The percentages for alcohol as a contributing factor in fatalities and serious injuries were all below the baseline from 2016 to 2022. The percentages for drug related fatalities dropped considerably from 2016 to 2018 and then showed an increasing trend in 2022. For serious injuries, the percentages involving drugs were at or slightly above the baseline from 2016 to 2018 and then rose above the baseline from 2019 to 2022. The percentages for fatalities that were fatigue-related were at or below the baseline while those for serious injuries were at or above the baseline except for a drop in 2022. These analyses indicate that there has been some progress in improving road safety in Canada from 2016 to 2022 compared to the 2011-2015 baseline period. However, more data for the period 2023 to 2025 may show greater improvement when they become available.
Background
In Canada, road safety is a shared responsibility between federal, provincial/territorial, and municipal governments. The federal government is mainly responsible for regulations that pertain to the manufacturing and importation of motor vehicles or equipment under the Motor Vehicle Safety Act, as well as the safety fitness of interprovincial and international motor carriers under the Motor Vehicle Transport Act. The Multimodal and Road Safety Programs Directorate of Transport Canada is responsible for administering these acts through the development of motor vehicle and motor carrier safety regulations and standards and their enforcement. It also:
- gathers data from provincial and territorial governments for the National Collision Database;
- conducts research on vehicle and road user safety;
- conducts collision and defect investigations; and
- informs the public on improving their safety while traveling.
Provinces, territories, and municipalities are responsible for:
- building and maintaining highways;
- commercial vehicle operations within provinces and territories;
- driver and vehicle licensing;
- research on road infrastructure and road user safety; and
- developing and implementing jurisdictional road safety initiatives (e.g. legislation, regulation, enforcement, road infrastructure, public awareness and education)
In addition, the Canadian Council of Motor Transport Administrators, along with key non-governmental agencies, such as the Canadian Association of Chiefs of Police, the Canadian Association of Road Safety Professionals, Parachute, and Mothers Against Drunk Driving, among others, play an important role in developing and delivering road safety programs in Canada. In addition, all levels of government as well as some nongovernmental groups participate in the Transportation Association of Canada, which is a national not-for-profit, technical association that focusses on road and highway infrastructure, and urban transportation.
Canada’s Road Safety Strategy 2025
Launched in 2016 by the Council of Ministers Responsible for Transportation and Highway Safety, Road Safety Strategy 2025 is the fourth national initiative to improve road safety in Canada. The first three national strategies helped to reduce fatalities and serious injuries by 44% and 56% respectively between 1996 and 2015 (Jonah, 2018).
The vision of Road Safety Strategy 2025: Towards Zero - The safest roads in the world” is to make Canada’s roads the safest in the world. This vision is similar to previous strategies but adds the vision of Towards Zero where deaths and serious injuries would eventually drop to zero (CCMTA, 2016).
The strategy’s objectives are to:
- raise public awareness and commitment to road safety;
- improve communication, cooperation, and collaboration among stakeholders;
- enhance legislation and enforcement of traffic laws;
- improve road safety information in support of research and evaluation;
- improve the safety of vehicles and road infrastructure, and;
- leverage technology and innovation.
The key guiding principles of Road Safety Strategy 2025 are:
- the implementation of a Safe System Approach by the provinces and territories in a manner that is appropriate to their environment based on the primary risk groups and contributing factors identified below;
- a directional downward trend in the rate-based number of fatalities and serious injuries, and;
- the ability to adopt road safety initiatives from an inventory, maintained by CCMTA, of best practice interventions that have been used by leading road safety countries and found to be effective in reducing fatalities and serious injuries.
The primary risk groups are:
- young/novice drivers (drivers under 25 or with less than 2 years of driving experience);
- vulnerable road users (pedestrians, cyclists, motorcyclists, and persons in personal mobilized devices);
- drivers of heavy commercial vehicles weighing over 4,536 kg or passenger transportation;
- medically at risk drivers (drivers with physical or cognitive impairments which affect a person’s ability to operate vehicles safely);
- high risk drivers, and;
- the general population.
The key contributing factors are
- distracted driving;
- alcohol impaired driving;
- drug impaired driving;
- fatigue impaired driving;
- speed and aggressive driving;
- unrestrained occupants;
- environmental factors;
- road infrastructure, and vehicle factors.
The road safety strategies focus on best practices, a matrix of key target groups and contributing factors, and include:
- policy, legislation and regulation;
- education and training;
- communication and awareness;
- enforcement;
- information, data and research;
- technology, and;
- linkages among stakeholders.
While this national strategy is in place, it is up to each jurisdiction to identify and develop programs to address local road safety issues. The Canadian Council of Motor Transport Administrators serves as the custodian of Road Safety Strategy 2025 by providing support and guidance where appropriate.
A new strategy is being developed for the period after 2025.
This article examines changes in road safety by comparing data on the number of fatalities and serious injuries for the period 2016 to 2022 with baseline data for the years 2011 to 2015 prior to Road Safety Strategy 2025 to determine the degree of progress that has been made.
Methodology
Data from the National Collision Database maintained by Transport Canada was used to examine the state of road safety in Canada during the period 2016 to 2022 compared to a baseline period of 2011 to 2015. Fatalities and serious injuries (i.e., injured persons who stayed in a hospital for at least one night) were examined.
The total number of fatalities and serious injuries for each of the years 2016 to 2022 were compared with the baseline years based on the average numbers for the years 2011 to 2015.
The following variables were analyzed in terms of the percentages of the total number of fatalities and serious injuries that they represented by these variables during the baseline years and during each of the years 2016 to 2022:
- non-use of seat belts;
- speeding as a contributing factor;
- driver distraction as a contributing factor;
- collisions occurring at intersections;
- young drivers aged 16 to 24;
- pedestrians;
- motorcyclists;
- bicyclists;
- involvement of commercial vehicles;
- drivers identified as having alcohol as a contributing factor;
- drivers identified as having drugs as a contributing factor;
- fatigue as a contributing factor.
The data for this article was provided by the Research and Evaluation Division, Road Safety and Motor Vehicle Safety, Transport Canada. The authors would like to thank Jean-François Lécuyer of Transport Canada for his assistance with the data and their analyses.
Results
Total Fatalities and Serious Injuries: Figure 1 shows the overall number of fatalities and serious injuries resulting from motor vehicle collisions in Canada during each of the years in the period 2016 to 2022 compared to the baseline period 2011 to 2015. Fatalities from 2016 to 2022 were either at or slightly below the 2011-2015 baseline as shown by the horizontal blue line. Serious injuries were below the baseline for all years as shown by the orange horizontal line and trended downward until 2021 and 2022 when they experienced a slight upward trend.
Figure 1

Figure 2
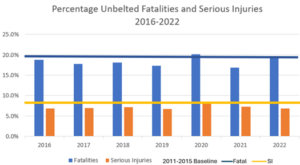
Unbelted Occupants: Figure 2 presents the percentage of fatally or seriously injured occupants who were unbelted at the time of the collision. The percentages for fatalities were either at or below the baseline for all years 2016-2022 with the exception of 2020 when it was slightly above the baseline. The percentages for serious injuries were below the baseline for all years except 2020 when the percentage was at the baseline.
Speeding: Figure 3 shows the percentages of fatalities and serious injuries that were speed-related. There was a small increase in the percentage of fatalities involving speeding in 2016 compared to the baseline, then there was a slight drop in 2017 and 2018 followed by an increasing trend above the baseline for 2019 to 2021, followed by a drop below the baseline in 2022. For serious injuries, the percentages involving speeding remained at or somewhat above the baseline from 2016 to 2022.
Collisions at Intersections: As shown in Figure 4, the percentages of fatalities that occurred at intersections were slightly above the baseline in 2016, dropped to the baseline in 2017, remained slightly below the baseline from 2018 to 2021, then went up to the baseline in 2022. The percentages for serious injuries that occurred at intersections were above the baseline for the years 2016 and 2019, and then at the baseline from 2020 to 2022.
Figure 3
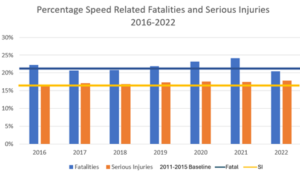
Figure 4
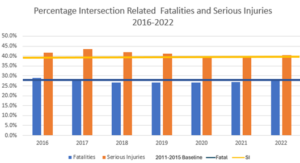 Figure 5
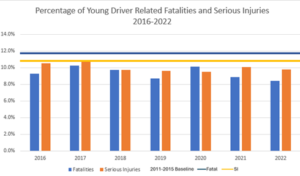
Young Drivers: The percentages of fatalities and serious injuries involving young drivers aged 16 to 24 are displayed in Figure 5. The percentages for fatalities were all below the baseline for the period 2016 to 2022. They also displayed a downward trend between 2017 and 2019, followed by a temporary increase in 2020 and a return to 2019 levels, or lower, in 2021 and 2022.The percentages for serious injuries were all below the baseline apart from 2017 when it was at the baseline.
Figure 6

Pedestrians: Figure 6 shows the percentages of collision fatalities and serious injuries that were pedestrians. The percentages of fatalities were at or above the baseline from 2016 to 2021 and then dropped below the baseline in 2022. The percentages of serious injuries that were pedestrians were either at or above the baseline for all years except in 2020 when the percentage was slightly below the baseline.
Figure 7
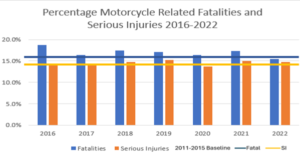
Motorcyclists: Figure 7 indicates that the percentages of fatalities that were motorcyclists were higher than the baseline from 2016 to 2021 and then dropped slightly below the baseline in 2022. Serious injuries increased somewhat above the baseline from 2016 to 2019, dropped below the baseline in 2020, and then increased above the baseline in 2021 and 2022.
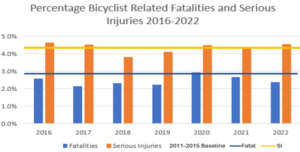
Bicyclists: The percentages of fatalities and serious injuries that were bicyclists are presented in Figure 8. The percentages of fatalities that were bicyclists were lower than the baseline for all years except for 2020 when it was slightly above the baseline. For serious injuries, the percentages for 2016 and 2017 were above the baseline, with a drop below the baseline in 2018 and 2019 followed by increases to or above the baseline in 2020 to 2022.
Figure 8
Commercial Vehicles: Figure 9 shows the percentages of fatalities and serious injuries that involved commercial vehicles. The percentages for fatalities were at or below the baseline percentage for all years except for 2017 when it was slightly above the baseline. The percentages for serious injuries were below the baseline for 2016, at, or slightly above the baseline from 2017 to 2019, below the baseline for 2020 and 2021 and then slightly above the baseline in 2022.
Distraction: Figure10 displays the percentages of fatalities and serious injuries that involved some form of distraction of the drivers. The percentages for fatalities were at or below the baseline with the exception of 2017 when it was above the baseline. For serious injuries, the percentages were at or below the baseline for all years with the exception of 2021, when it was slightly above the baseline.
Figure 9

Figure 10

Alcohol: Figure 11 shows the percentages of fatalities and serious injuries where alcohol was considered by the police to be a contributing factor in the collision. The percentages for fatalities and serious injuries were all below the baseline from 2016 to 2022. The percentage of fatalities showed a downward trend from 2016 to 2019, then fluctuated up and down between 2020 and 2022. Serious injuries were below the baseline for all years and exhibited a downward trend from 2020 to 2022.
Other Drugs: Figure 12 displays the percentages of fatalities and serious injuries where drugs were considered by the police to be a contributing factor. The percentages for fatalities were above the baseline in 2016, then decreased considerably from 2016 to 2018 increasing from 2019 to 2022, except for 2021 when it dropped slightly. The percentages for serious injuries dropped from above the baseline in 2016 and 2017 to below it in 2018 and then exhibited an upward trend to 2021 dropping slightly in 2022.
Figure 11
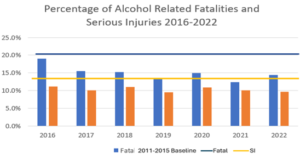
Figure 12
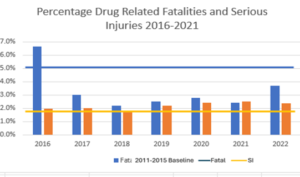
Figure 13

Fatigue: Figure 13 shows the percentages of fatalities and serious injuries that were fatigue related. Except for 2016, all the percentages for fatalities were at or below the baseline although they fluctuated up and down. The percentages for serious injuries were slightly above the baseline in 2016 and 2017, dropped to the baseline in 2018 to 2020, increased above the baseline in 2021, and then dropped below the baseline in 2022.
Discussion
The analyses of the fatality and serious injury data for the period 2016 to 2022 show that there has been some improvement in the level of road safety in Canada compared to the 2011- 2015 baseline. The number of fatalities exhibited a slight downward trend below the baseline from 2016 to 2022 but there was a stronger downward trend in the number of serious injuries which is a positive sign. The percentages of unbelted fatalities and serious injuries were generally below the baseline with the exception of 2020 when they were at or above the baseline level. The percentages for speed-related fatalities trended downward from 2016 to 2018 then upward above the baseline from 2019 to 2021 followed by a decrease in 2022. The percentages for serious injuries that were speed-related remained either at or above the baseline. These results regarding speeding are consistent with what Vingilis, et al. (2024) found when examining the impact of COVID 19 on speeding during this period.
The percentages for fatalities occurring at intersections were at or above the baseline level in 2016 and 2017 below the baseline for 2018 to 2021 and back to the baseline in 2022. The percentages for serious injuries at intersections were above the baseline level for 2016 to 2019 and at the baseline from 2020 to 2022. The percentages for fatalities that were aged 16-24 were below the baseline for all years but fluctuated up and down. The percentages for seriously injured young drivers were below the baseline for all years except 2017 when it was at the baseline.
The percentages of fatalities that were pedestrians were above or at the baseline for the years 2016 to 2021 and then dropped below the baseline in 2022.The percentages for those seriously injured who were pedestrians were either at or above the baseline for all years. For the years 2016 to 2021, the percentages for fatalities who were motorcyclists were above the baseline level but dropped below the baseline in 2022. The percentages for those seriously injured that were motorcyclists were either at or above the baseline for all years with the exception of 2020 when it was slightly below the baseline. The percentages for fatalities that were bicyclists were below the baseline for all years except for 2020 when it was at the baseline. The percentages for those seriously injured who were bicyclists were above the baseline in 2016 and 2017 below it in 2018 and 2019 and then at or above the baseline from 2020 to 2022. The percentages for fatalities involving commercial vehicles were either at or below the baseline percentage during 2016 to 2021 except in 2017 when it was slightly above. The percentages for serious injuries were below the baseline for 2016, at the baseline for 2017 to 2019, below the baseline for 2020 and 2021 then back to the baseline in 2022.
The percentages for fatalities involving distraction were at or below the baseline for all years except 2017 when it was above. For serious injuries, the percentages involving distraction were at or below the baseline for all years except 2021 when it was above the baseline. The percentages for fatalities that were fatigue-related were at or below the baseline for all years except for 2016 when the percentage was slightly above the baseline. The percentages for serious injuries involving fatigue remained at or below the baseline level except for 2016 and 2021 when they were slightly above the baseline.
The percentages for alcohol as a contributing factor in fatalities and serious injuries were below the baseline for all years. The percentages for fatalities where drug involvement was a contributing factor dropped considerably from 2016 to 2018 and then exhibited an upward trend to 2022 although not above the baseline. The percentages for drugs as a contributing factor in serious injury collisions were slightly above or at the baseline from 2016 to 2018 then exhibited an upward trend from 2019 to 2021 which may reflect the decriminalization of cannabis use in 2018. There was a higher prevalence of alcohol as a contributing factor than other drugs over the period 2016 to 2022 which may in part reflect a larger alcohol problem and/or that it is easier for police officers to detect alcohol than drugs. It should be noted that the data on alcohol and drugs as contributing factors in collisions come from police reports on these collisions and may underrepresent alcohol and drugs as contributing factors.
If Canada is going to show significant improvement in road safety by the end of the Road Safety Strategy 2025, it will require a greater effort by all levels of government in addressing issues like speeding, intersection safety, young drivers, pedestrians, motorcyclists, driver distraction and alcohol and drug impairment. However, the data presented in this article only cover the first seven years of the Road Safety Strategy 2025. Hopefully, data for the years 2023 to 2025 will show that Canada is getting closer to meeting the objectives of this Strategy.
References
Canadian Council of Motor Transport Administrators (2016). Canada’s Road Safety Strategy 2025 – Towards Zero: The Safest Roads in the World.
Jonah, B.A. (2018). Canadian Road Safety Strategies. Paper presented at Canadian Association of Road Safety Professionals Conference, Victoria, 2018.
Vingilis, E, Seeley, Wickens, C., Jonah, B, Johnson, J, Rapoport, M, Beirness, D, Boase, P. (2024) COVID-19 and speeding: Results of population-based survey of Ontario drivers. Journal of Safety Research, Volume 91, December 2024, Pages 58-67